Following 94 Million Relationships Down the Rabbit Hole
We ran an experiment: take a real question, point it at a massive academic knowledge graph, and keep asking follow-ups to see how deep LLM-driven analysis can actually go.
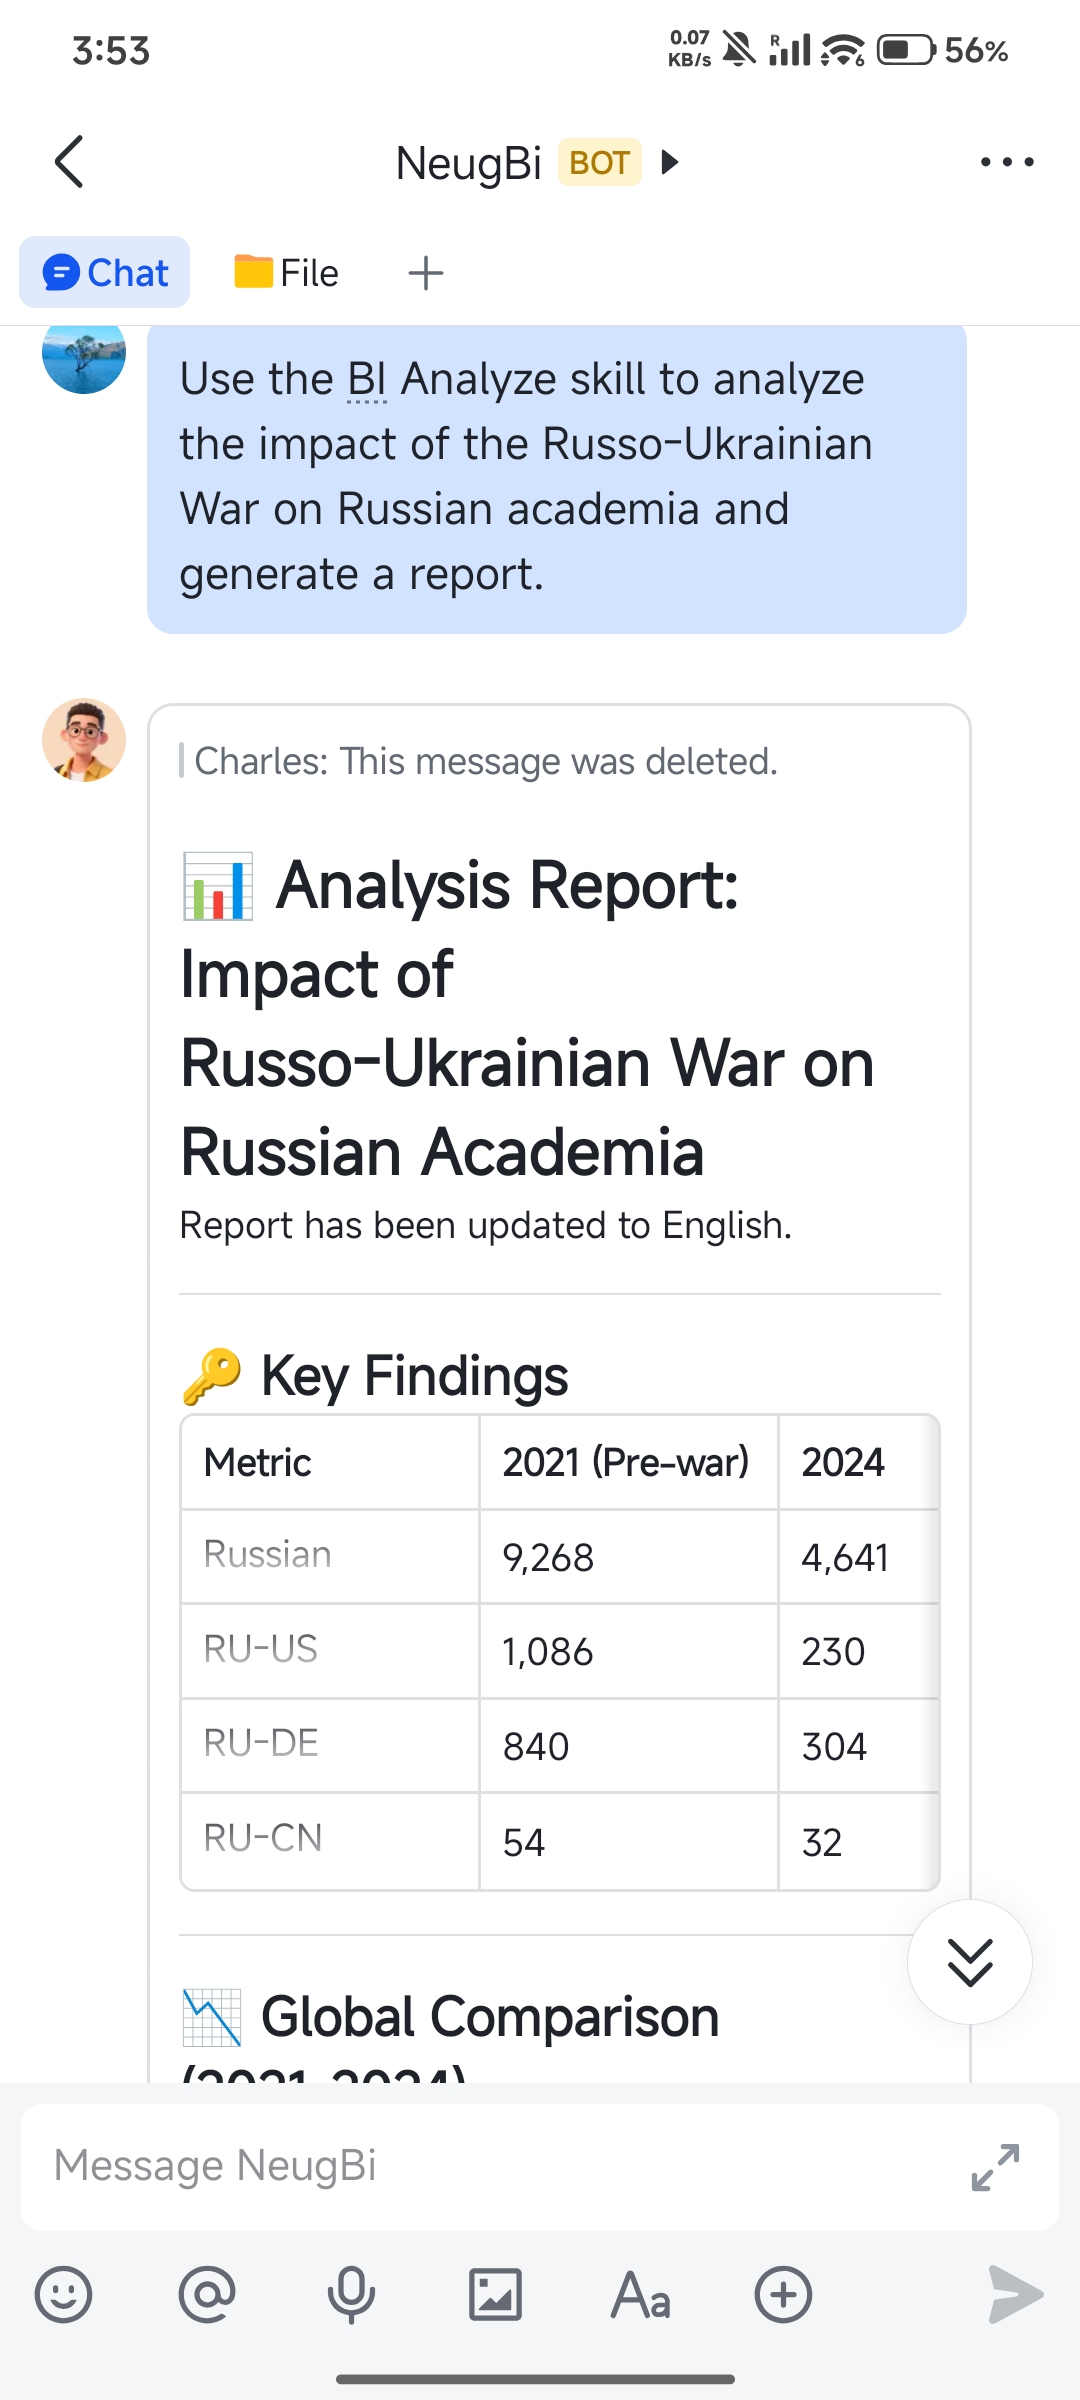
The question: “What impact has the Russia-Ukraine conflict had on Russian academia?”
The data comes from OpenAIRE, one of Europe’s largest open research data platforms: 22 million entities, 94 million relationships, spanning publications, authors, institutions, funding sources, and journals. Too large to feed into any LLM directly — but perfect for structured analysis.
Here’s how the investigation unfolded.
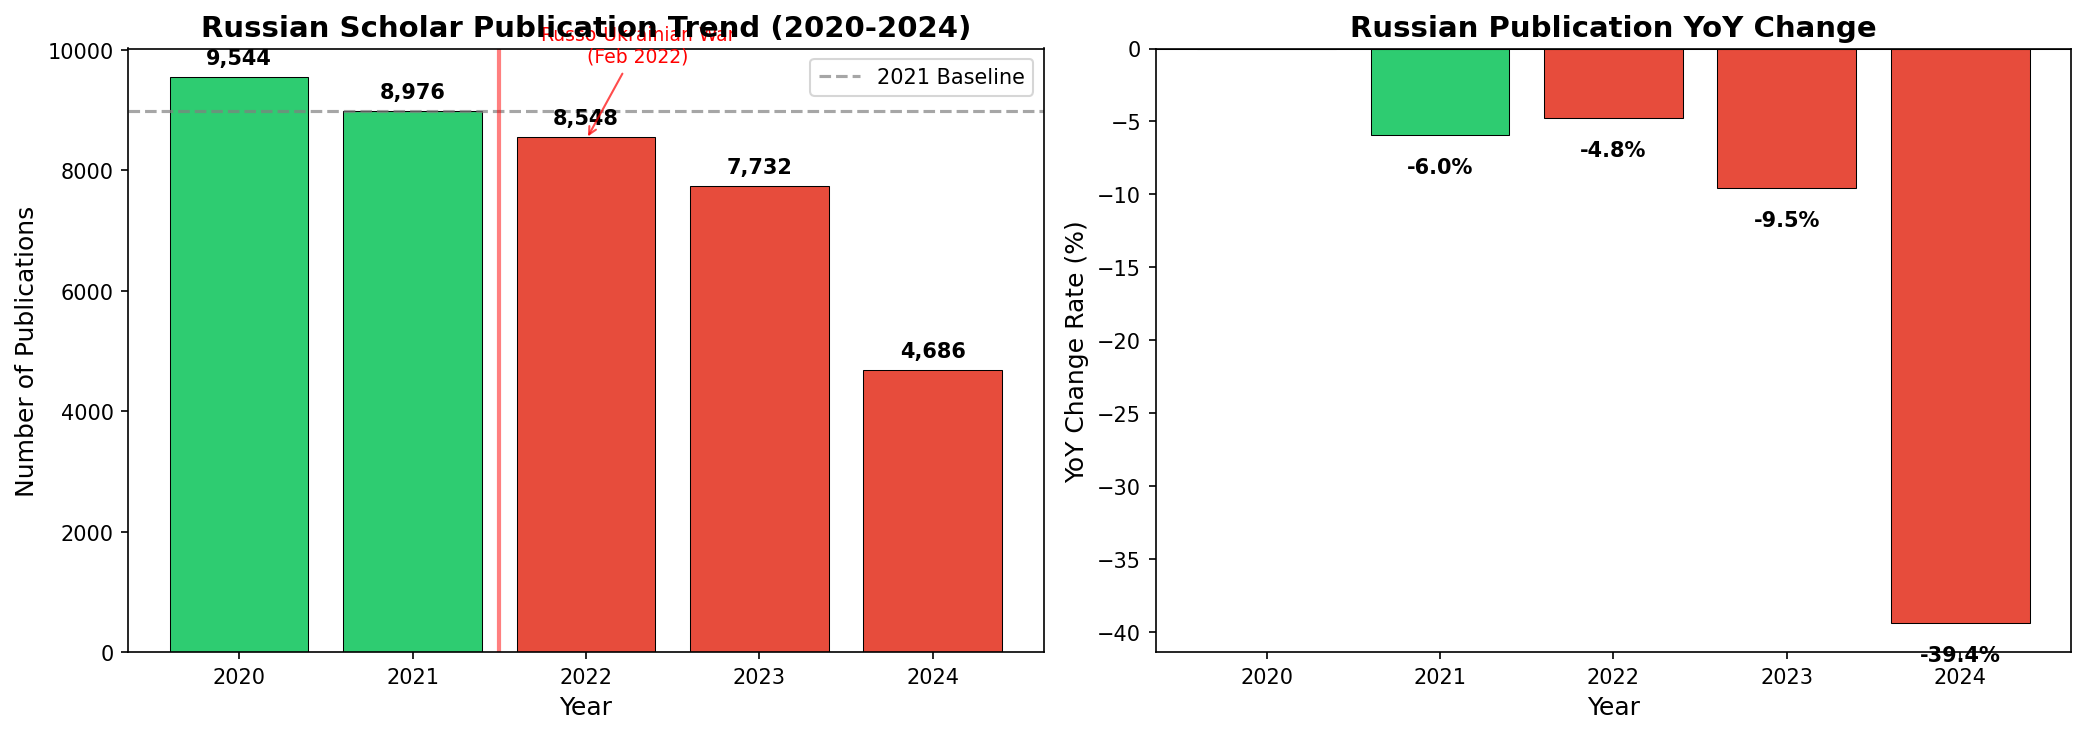
Question 1: Did publication output actually decline?
The obvious starting point. We matched Publication ↔ Organization patterns across the graph and aggregated by country and year to track Russia’s publication trend.
| Year | Publications | YoY Change | Cumulative |
|---|---|---|---|
| 2020 | 9,544 | - | 0% |
| 2021 | 8,976 | -6.0% | -6.0% |
| 2022 | 8,548 | -4.8% | -10.4% |
| 2023 | 7,732 | -9.5% | -19.0% |
| 2024 | 4,686 | -39.4% | -50.9% |
A mild decline before the war, accelerating sharply after 2022, nearly halved by 2024.
But is this Russia-specific, or a global trend? We sliced the same analytical structure differently — global publication volume actually increased in 2022. Comparing 2021→2024: Russia dropped 47.8%, far exceeding the US and Germany at 27.6%, while China grew 14.8%.
This isn’t a global downturn. It’s a cliff — and it’s Russia’s alone.
Question 2: Did the funding dry up?
When publication output drops, the first instinct is to follow the money.
We extended our analysis by adding a Funding dimension on top of the existing structure — not starting over, but incrementally expanding what we’d already built.
The result: the European Commission (EC) had been a major funder of Russian research. After 2022, EC completely cut off funding for projects involving Russian institutions — while continuing to fund 26 Ukrainian institutions. This aligns perfectly with the EC’s official policy announcements.
The money did dry up. But does that explain everything?
Question 3: Are journals shutting the door too?
We pivoted to a different angle, adding a Publisher dimension to the structure from Question 1: which journals changed their stance toward Russian papers around 2022?
Finding: EDP Sciences dramatically reduced publications from Russian institutions after 2022. Further investigation revealed that EDP Sciences had publicly declared support for Ukraine. And crucially, their publication volume from other countries didn’t see a comparable drop — this wasn’t a general contraction, it was selective.
Funding was being cut. Publishing channels were narrowing.
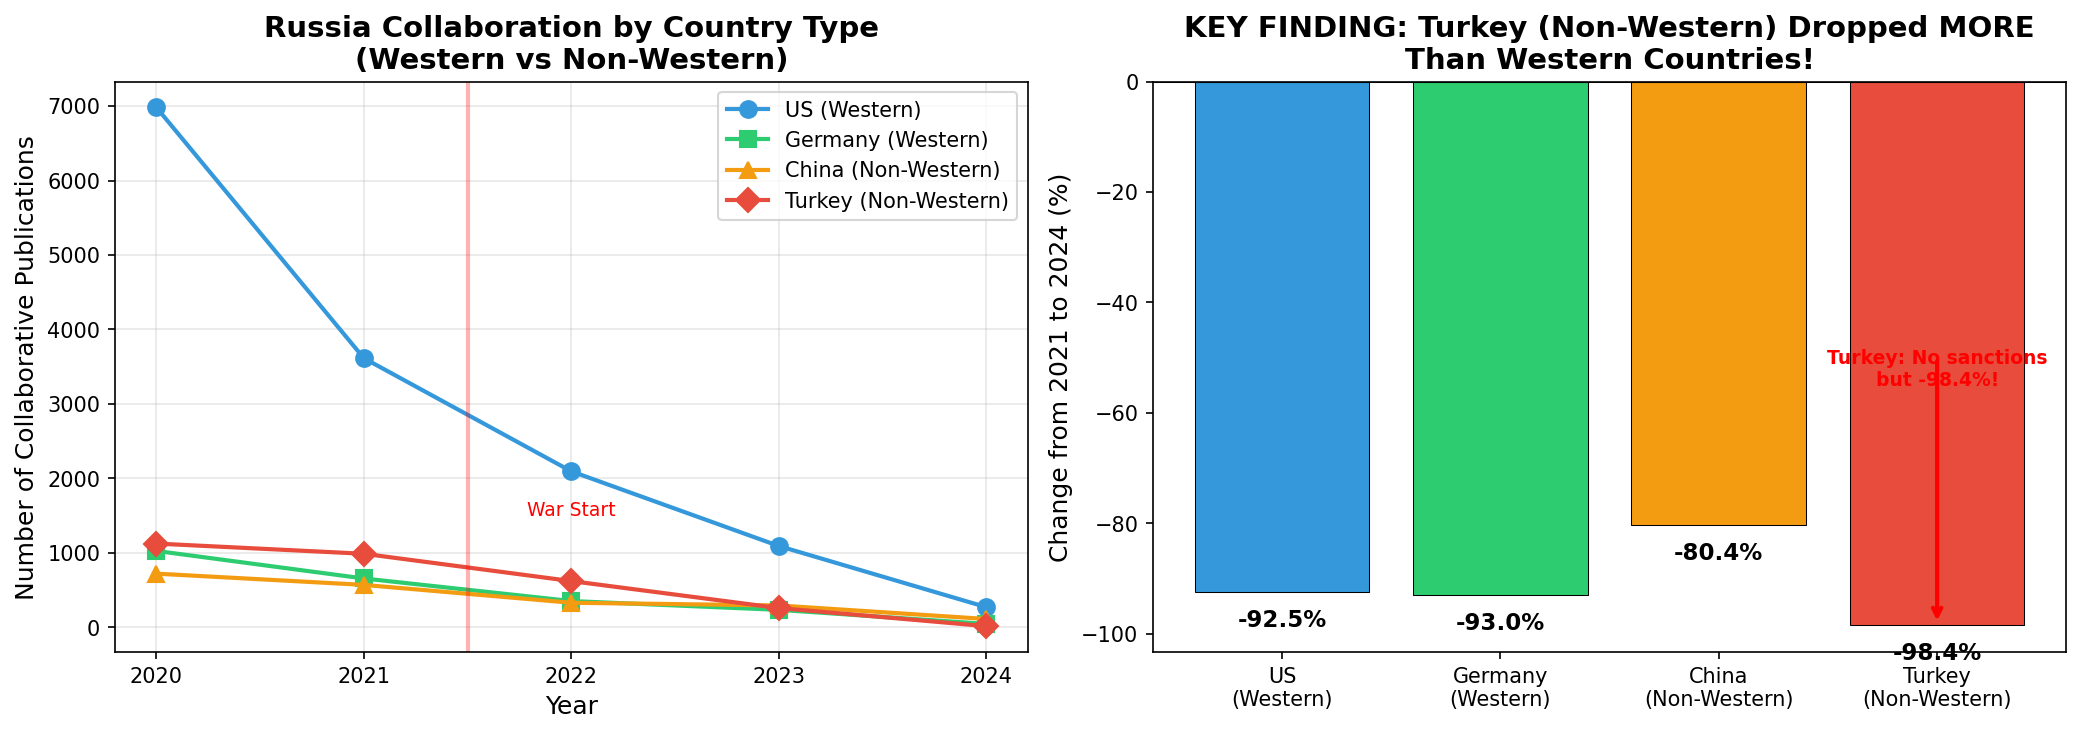
Question 4: What happened to the collaboration network?
The previous questions looked at individual factors. We zoomed out to the big picture — querying Author(country=RU) → Publication → Organization to map how Russia’s collaboration with each country changed over time.
| Partner Country | 2021 | 2024 | Change | Country Type |
|---|---|---|---|---|
| Turkey | 988 | 16 | -98.4% | Non-Western, no sanctions |
| Germany | 656 | 46 | -93.0% | Western, sanctions |
| USA | 3,614 | 271 | -92.5% | Western, sanctions |
| China | 570 | 112 | -80.4% | Non-Western, no sanctions |
Wait — the steepest drop is Turkey?
-98.4%. A non-Western country. A country that imposed no sanctions on Russia. And yet the collaboration decline is worse than with the US or Germany.
This breaks a seemingly natural assumption: that the decline is primarily sanctions-driven. If sanctions were the main cause, Western countries should show the steepest drops. But the data tells a different story.
Sanctions are part of the picture, but the deeper shift is systemic: the entire international academic network is distancing itself from Russia. It’s not that certain countries stopped cooperating — Russia is being structurally marginalized from the global research fabric.
Why could we keep asking?
Looking back at these four steps, each finding naturally raised the next question. This “follow the thread” experience feels intuitive — analysis should work this way.
But if you’ve used traditional data analysis tools, you know reality is different. The typical workflow looks like this:
Ask question → get result → want to follow up → realize the data model doesn’t have that dimension → ask a data engineer to redesign the schema → rebuild the wide table → rerun the query → finally see the result → want to follow up again → redesign again → …
Every follow-up costs as much as the first question. Three questions means three full analysis cycles from scratch. So most analyses stop at the surface — not because people don’t want to go deeper, but because going deeper is prohibitively expensive.
Text-to-SQL and NL2BI tools solve the problem of “how to ask the first question more easily” — having an LLM translate natural language into queries. That’s genuinely useful, but it doesn’t solve the follow-up problem. The SQL gets generated, but the underlying data model is still rigid, intermediate results are still discarded, and every new question still requires full recomputation.
What we set out to solve is exactly this: make follow-up questions dramatically cheaper than the first one.
| Step | Question | Operation | What was reused |
|---|---|---|---|
| 1 | Did output decline? | Match Pub↔Org on graph, aggregate by year+country | — |
| 2 | Did funding dry up? | Add Funding dimension | Pub-Org structure from Step 1 |
| 3 | Are journals biased? | Add Publisher dimension | Pub-Org structure from Step 1 |
| 4 | How much did collaborations drop? | Match Author→Pub→Org, aggregate by country | Underlying data structures |
The analytical structure built in Step 1 was reused across all subsequent steps. Each follow-up wasn’t “start over” — it was “take one more step from where we left off.”
How it works under the hood
Keeping the follow-up chain going requires three things simultaneously: the analytical structure must be dynamically extensible, intermediate results must persist, and computation over massive data must be fast enough for interactive use. We tackle each with a specific design.
Hypergraph Data Model: a schema that grows with your questions
Traditional analytical data models (star/snowflake schemas) are designed upfront. You must decide on all dimensions before asking any questions — miss one, and you start over.
We designed a Hypergraph-based data model with a composable operator algebra:
- Source: perform pattern matching on the raw data graph to produce a hypergraph — the starting point
- Join: add new dimensions to an existing hypergraph — the ability to extend on follow-up
- View: materialize intermediate results — the system’s “memory” of what’s been computed
- DrillDown / RollUp / Slice / Dice: multidimensional slicing and aggregation on hypergraphs
These operators form a closed algebra: freely composable and chainable. This is what powers the “add a dimension and keep going” experience in the case study above — the schema isn’t predefined, it grows as your curiosity leads.
Unbiased Sampling: sub-second responses over 94 million relationships
Whether you can sustain a chain of follow-ups depends heavily on how long each step takes. If every question takes five minutes to run, you’ll lose patience by Step 3.
But the core operation behind these analyses is subgraph matching — exhaustively computing this over a large-scale graph is prohibitively expensive. Our approach: unbiased sampling. Instead of enumerating all matches, we uniformly sample a subset and use statistical methods to estimate aggregates. “Unbiased” means the estimates don’t systematically skew high or low.
For analytical tasks, this trade-off is remarkably effective: what matters is “did something change, which direction, who changed most” — not whether every number is exact to the last unit. In practice, COUNT estimates have an average error rate of just 0.27% — trend-level conclusions stay perfectly intact while computation cost drops by one to two orders of magnitude.
NeuG: co-located storage and computation
NeuG is our graph storage engine. The key design decision: sampling-based subgraph matching algorithms are implemented directly in the storage layer, so computation executes where the data lives — no need to shuttle data to a separate system.
Many systems don’t bottleneck on the operators themselves, but on data movement. NeuG’s principle: the best optimization is not moving data at all.
For the formal definitions of the hypergraph data model, operator design, and theoretical guarantees of the sampling algorithms, see our paper: A Hypergraph-Based Framework for Exploratory Business Intelligence.
Benchmarks
Beyond the real-world case study above, we ran systematic evaluations on LDBC Social Network Benchmark datasets (SF1, SF3, SF10) across 13 analytical queries of varying complexity.
On the largest scale, SF10 (~10GB), ExBI was the only system to complete all 13 queries. Neo4j completed 7; MySQL completed 2.
Performance:
- vs. Neo4j: 16.21x average speedup, up to 146.25x
- vs. MySQL: 46.67x average speedup, up to 230.53x
Speed doesn’t come at the cost of accuracy — COUNT average error rate is 0.27%, MAX error is near zero.
For the full experimental design and analysis, see the paper.
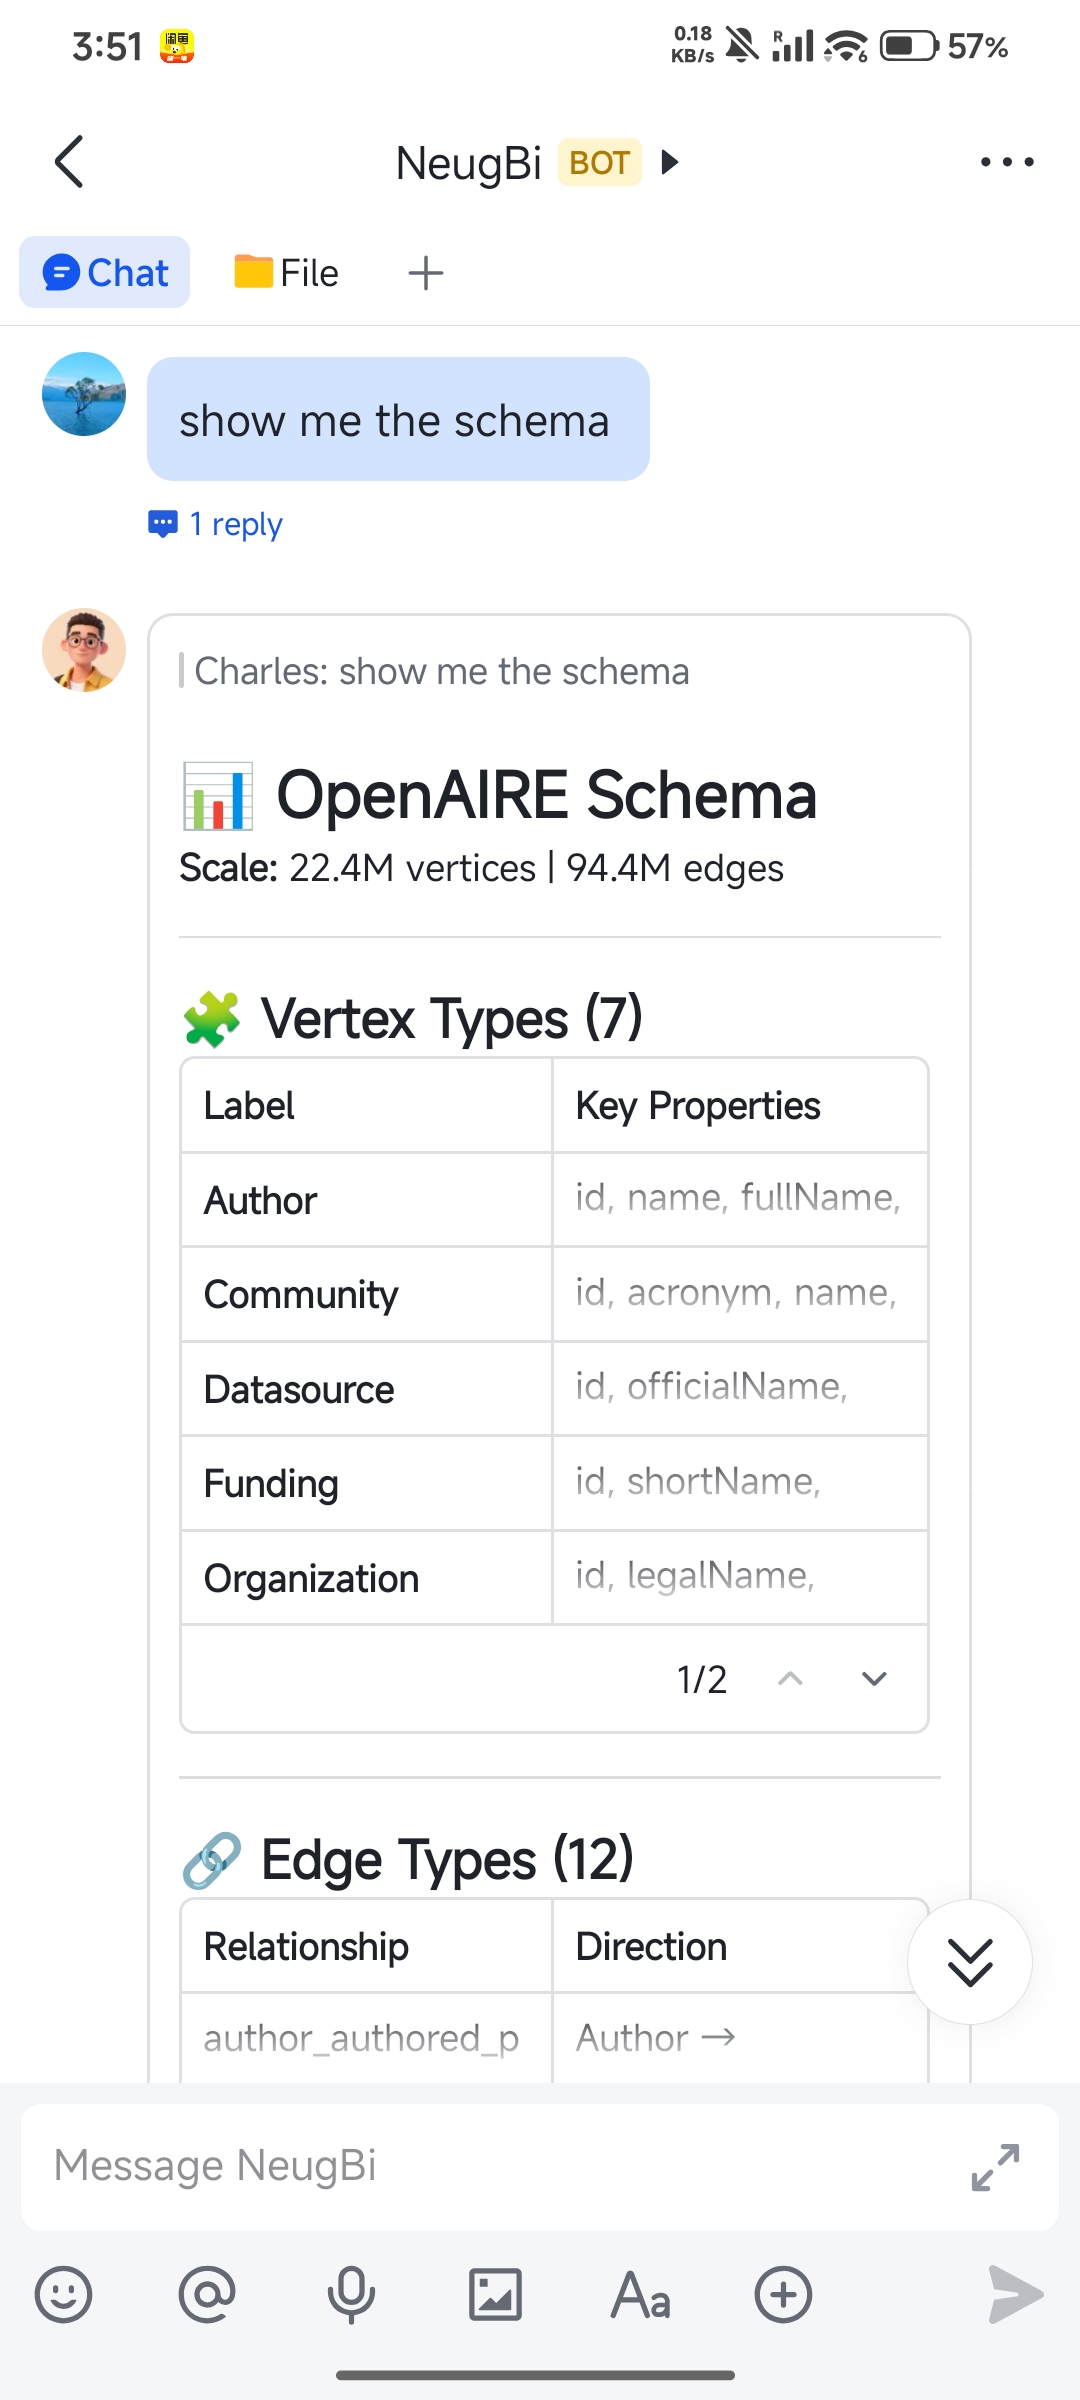
Try it yourself
We integrated this analytical capability into OpenClaw by adding NeuG-related data loading and analysis skills. The case study above was conducted entirely in this environment.
 |  |
-
NeuG: https://github.com/alibaba/neug
-
NeuG data loading and analysis skills: https://github.com/Louyk14/neug/tree/main/skills
-
Docker (code + OpenAIRE dataset, ready to use): https://hub.docker.com/r/shunyangli/neugbi
-
Paper: A Hypergraph-Based Framework for Exploratory Business Intelligence
-
Full analysis report: Impact of the Russia-Ukraine War on Russian Academia